Characteristic Values
Why “95%”?

“Most people and even most scientists still don’t know much about statistics except that there is something good about the number 0.05”. [1]
Introduction
Limit state design is a philosophy under which structures are designed such that the probability that a number of performance criteria are exceeded is deemed to be acceptably small during the functional lifetime of the structure. Engineers must make calculations to ensure, for example, that a particular design is both strong enough (so that it doesn’t collapse in use) and stiff enough (so that it doesn’t deform too much in use).
In this note we will briefly examine the origins of one part of the calculation process for limit state design, the characteristic value of a material property.
It is well known that materials have inherent variability. For example, if we had one thousand concrete cubes that had all been cast from the same concrete mixture and cured for 28 days, and tested them one by one in uniaxial compression, we would obtain a large number of different values for the compressive strength of the concrete. With this data we could plot a histogram of the strength values, and from this derive some probabilistic distribution that represents the chosen material property (in this case, compressive strength of concrete). Often, we assume that such properties are normally distributed.
This information is useful as it tells us the average strength of the material being tested along with information on how the property varies (for example the range between the weakest and strongest samples).
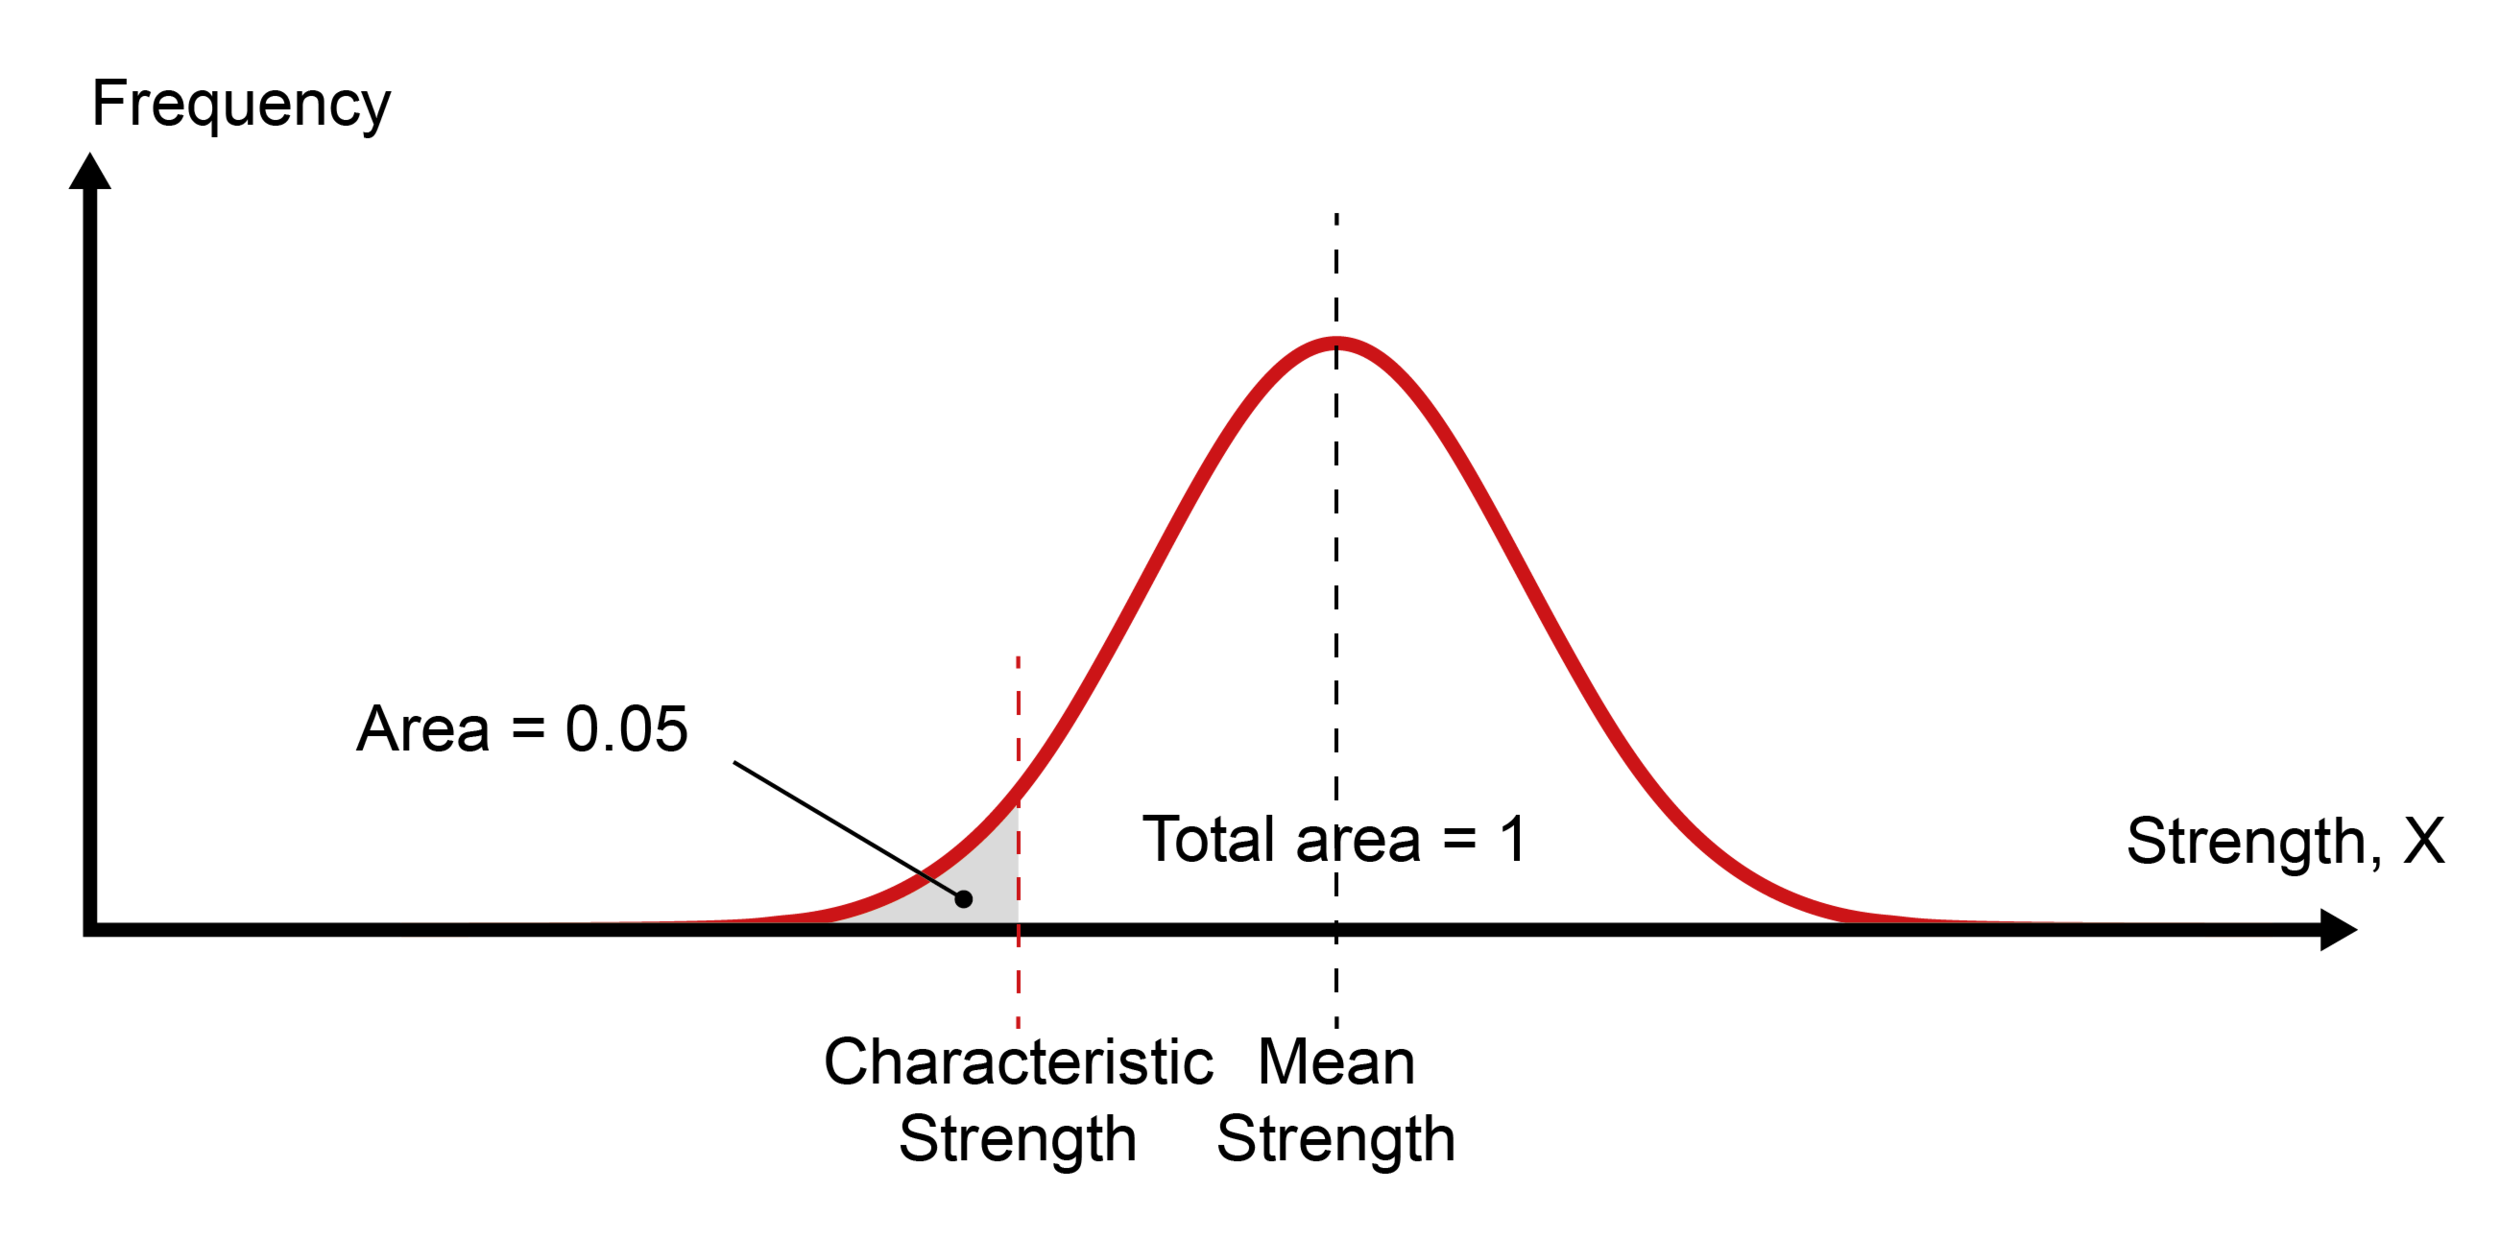
Structural engineers must choose an appropriate value of material strength to use in their calculations. In most design codes, this material strength is based around a characteristic value. The characteristic value of a material property is normally defined as the value below which not more than 5% of test results may be expected to fall. In our sample of 1000 concrete cubes, this would mean approximately 950 of the samples would be stronger than the characteristic value of the material strength. This is shown in the image below:
But why do we take a 95% value as the characteristic value? Why not 50%, or 99.9%?
The explanation has its origins in a proposal by statistician RA Fisher. In his highly influential book “Statistical Methods for Research Workers” published in 1925, Fisher proposed a 1 in 20 chance of being exceeded by chance as a suitable limit for statistical significance. In other words, if a bench-top lab test of a hypothesis worked 19 times out of 20, one could say with some certainty that the hypothesis was proved. Fisher was highly influential, and the 1 in 20 approach was widely adopted.
... it is convenient to draw the line at about the level at which we can say: "Either there is something in the treatment, or a coincidence has occurred such as does not occur more than once in twenty trials."... [2]
In the absence of a rational approach for communicating variations in material properties, the first structural design codes adopted the same limit (95%) as a suitable definition for loading and characteristic material properties. These limits have stuck, and students today are taught about 95% values, and they remain embedded in the philosophy of design codes.
Discussion
Characteristic material properties are divided by material partial safety factors to arrive at design values, which engineers then use in their calculations. We are therefore using statistically rather extreme values for the properties of materials in buildings. These statistical extremes are applied in all design cases.
MEICON is considering:
What is the impact on total material consumption of adopting statistically extreme material properties?
Do designers appreciate the origins of characteristic values, and how these are used in reliability analysis?
What might the impact be of adopting alternative values for characteristic material properties in appropriate limit states?
What might the material savings be if characteristic values could be varied?
What might the unintended consequences of such a change be?
What do you think?
Get involved by joining MEICON.
References
[1] Efron, B., 1998. R. A. Fisher in the 21st Century. Statistical Science, 13(2): p. 95-114.
[2] Fisher, R. A., 1926. The arrangement of field experiments. Journal of the Ministry of Agriculture, 33, 503-513 (quote on page 504).
Further reading
Cowles, M., and Davis, C., 1982. On the Origins of the .05 Level of Statistical Significance. American Psychologist
Ellingwood, BR., Acceptable risk bases for design of structures. https://doi.org/10.1002/pse.78